Trader Detail view explained
Trader Detail view explained
The Trader Detail page is the deep-dive view for one Trading Model.
You reach it from the Trading Models list in the symbol dashboard by clicking Details.
This page combines:
- scorecard / KPIs
- walk-forward validation
- model lifecycle status
- regime context
- historical backtest snapshots
- personality / stability metrics
- balance and price chart views
- trade list
Score Card (left column)
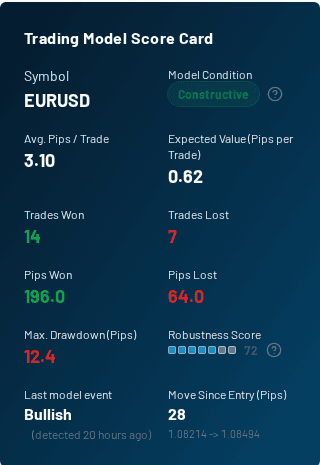
The Trading Model Score Card summarizes the model's current live/backtest state.
Key fields:
- Symbol: the market this model trades
- Model Condition: current model signal status / state
- Avg. Pips / Trade: average outcome per trade
- Expected Value (Pips per Trade): estimated average edge per trade
- Trades Won / Trades Lost: win/loss count split
- Pips Won / Pips Lost: aggregate positive vs. negative pips
- Max. Drawdown (Pips): worst historical pullback in the analysis window
- Robustness Score: stability-focused score indicator
- Last model event: latest BUY/SELL model event and elapsed time
- Move Since Entry (Pips): current move from the detected entry event
Walk-Forward Validation
This panel shows whether the model still behaves similarly in the latest fold compared with the earlier reference folds inside the recent backtest window.
Key fields:
- Adjustment: the fitness multiplier impact from walk-forward validation
- Consistency: how even fold scores are across the window
- Coverage: how many folds produced valid scores
- Train Score: average quality of the earlier folds
- Latest Fold: most recent out-of-sample fold score
- Fold Scores: small per-fold bars so you can spot collapse vs. broad stability quickly
Use this panel to answer a practical question: "Is this model still holding up in the freshest slice of data, or was its recent strength mainly concentrated in earlier folds?"
Model Lifecycle
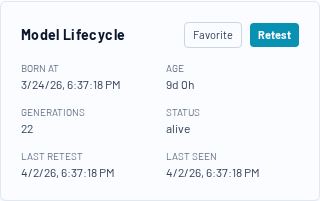
This panel shows operational metadata about the Trading Model:
- Born At: when the model first appeared
- Age: elapsed time since model birth
- Generations: how many evolutionary generations it has survived
- Status: current lifecycle state
- Last Retest: when it was last re-evaluated
- Last Seen: most recent observation in the pipeline
Actions:
- Favorite: add/remove the model from your favorites list
- Retest: trigger a new retest (when available in your environment)
Regime Context
If available, this panel compares:
This helps answer: "Is this model currently being used in a market regime it tends to handle well?"
Model History
The history chart tracks key metrics over previous backtest snapshots (for example: fitness, stability score, win rate, expected value, drawdown).
Use it to evaluate whether the model is improving, degrading, or fluctuating.
Metric-by-metric guide: Trader history metrics chart explained
Personality Layer (Behavior / Risk / Stability)
This section explains how the model behaves, not just what it returned.
It includes:
- Behaviour (aggression, tempo, edge)
- Risk (risk score, avg stop, drawdown ratio, resilience)
- Execution (win rate, avg RRR, entry logic / PM class)
- Stability (stability score, std dev, PF, Sharpe, Sortino, Calmar, exposure, drift)
This section is especially useful when two models have similar fitness but very different risk profiles.
Balance and Price sections
- Balance: realized/floating balance curves for the model
- Sup/Res Overlay (price chart): price action with support/resistance and channel overlays
- Trading Model DNA: entry logic, position manager, and regime filter descriptions
- Trades this model made: detailed trade list with timestamps and pips
