Symbol Dashboard explained
Symbol Dashboard explained
The Symbol Dashboard is the main market-analysis workspace for one instrument (for example EURUSD, XAUUSD, USDJPY, SP500, DAX).
It combines market regime, trend state, price structure, and the currently dominant Trading Models.
Page sections (top to bottom)
Market Panel
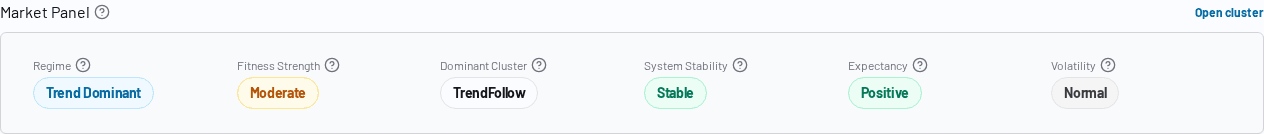
The Market Panel is a compact regime summary for the selected symbol.
Fields:
- Regime: current market structure (
Trend Dominant,Range,Mixed,Unstable) - Fitness Strength: how strong the currently detected edge/trend context appears
- Dominant Cluster: currently leading model cluster (or
—) - System Stability: whether current conditions look stable vs. shifting
- Last High-Confidence Entry: minutes since the last strong signal
- Expectancy: near-term edge estimate (
Positive,Neutral,Negative) - Volatility: current volatility state (
Expanding,Normal,Contracting)
Detailed field guide: Market Panel field guide
Trend Matrix
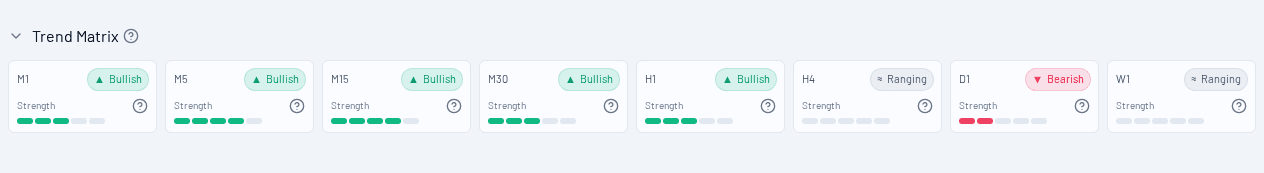
Shows trend direction and strength across multiple timeframes (M1 to W1).
- Use it to identify alignment (for example bullish on M5, M15, H1)
- Conflicts between short and higher timeframes often indicate transitions
See also: Trend Matrix field guide
Trend History + Trend Strength
These sections show how trend states evolved over the recent window:
- Trend History: matrix over time (timeframe rows, time columns)
- Trend Strength: scalar score chart for the selected timeframe
Use them to detect:
- strengthening trends
- trend fades
- regime flips
Support & Resistance (Price Chart)
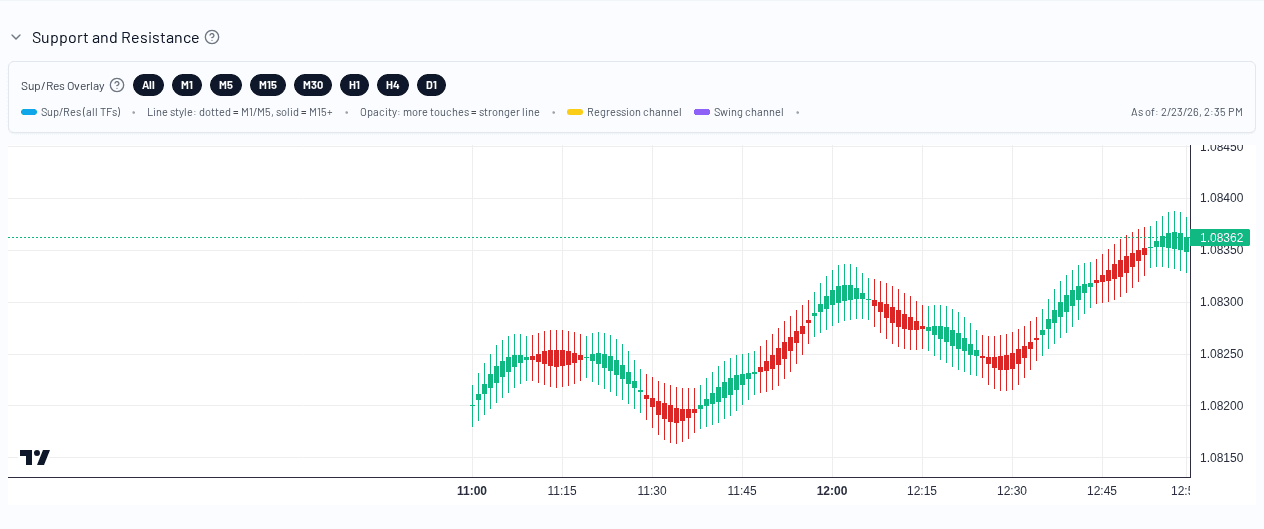
This chart overlays:
- candles
- horizontal support/resistance levels
- regression channel (yellow/orange diagonals)
- swing channel (purple diagonals)
Sup/Res overlay notes:
- dotted horizontal lines =
M1andM5 - solid horizontal lines =
M15+ - stronger opacity = more touches
- timeframe chips let you filter visible levels
Trading Models (Live models list)
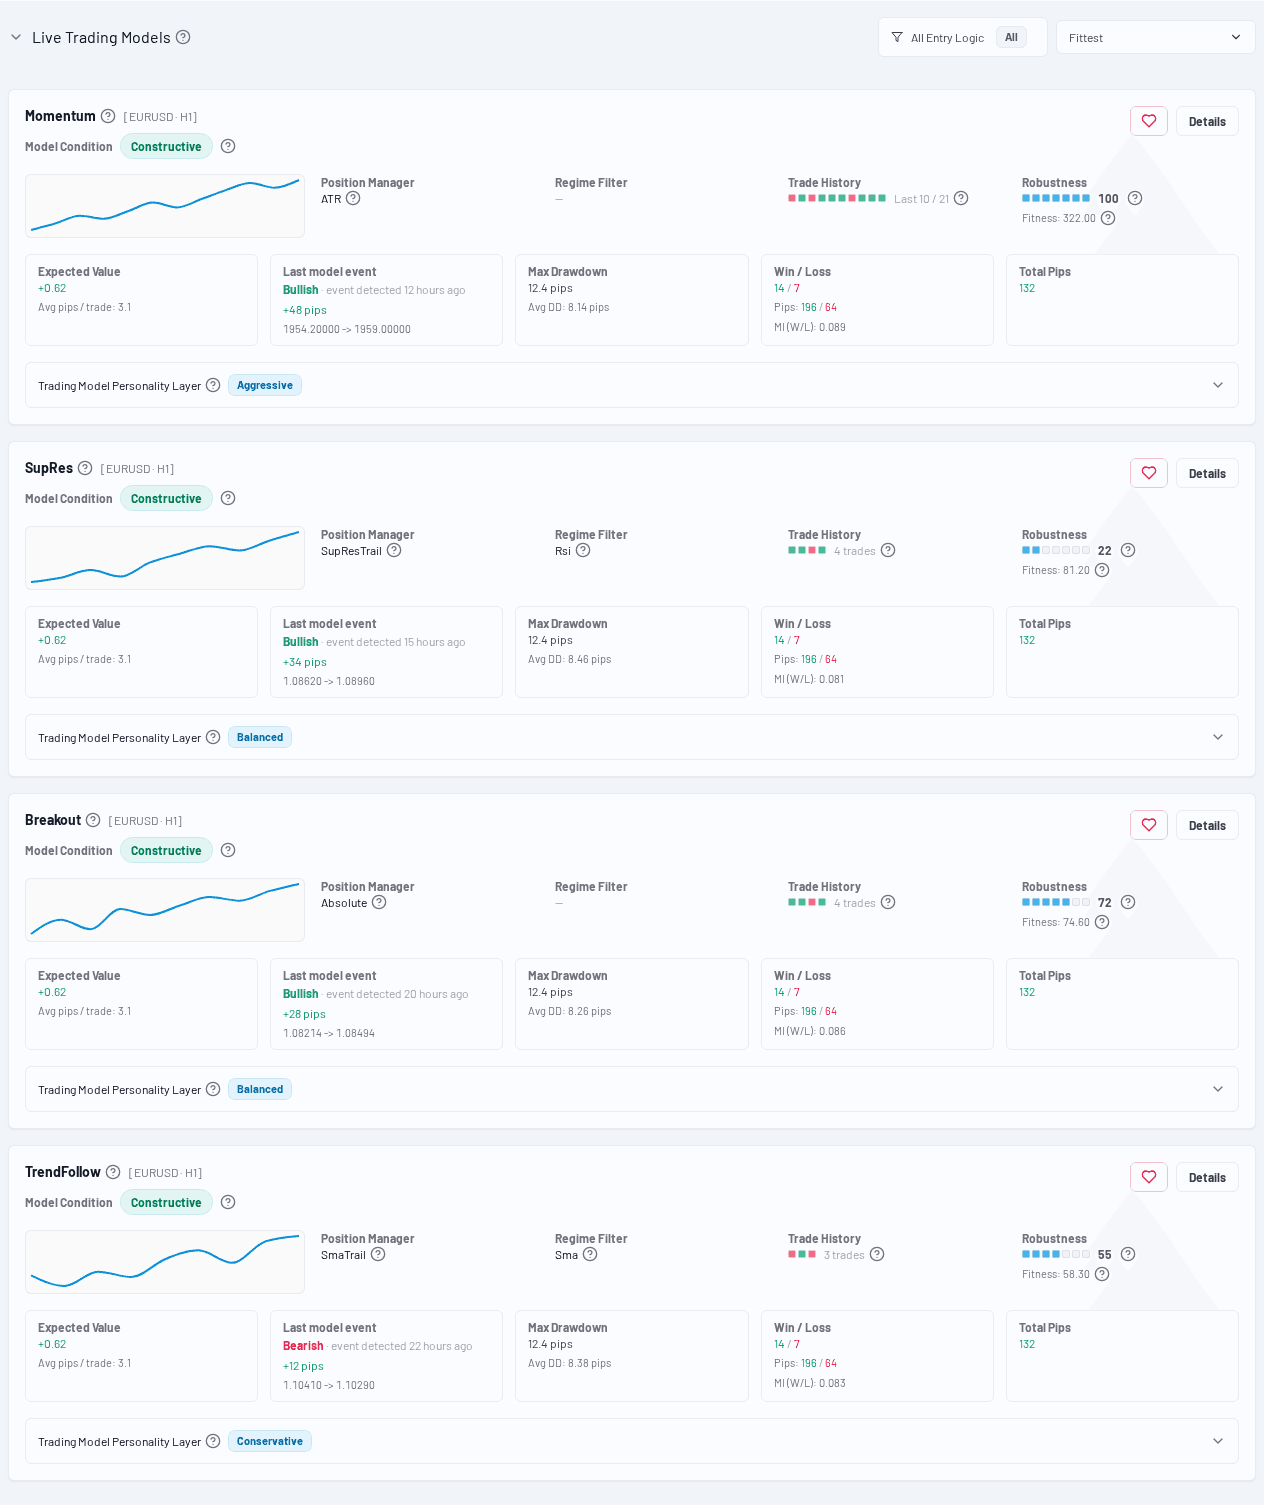
This is the ranked list of currently relevant Trading Models for the symbol.
You can:
- sort by Fitness, Latest, or Entry move
- filter by Entry Logic
- open the Trader Detail page for a specific model
Field-level guide: Trading Model card fields explained
Practical workflow (recommended)
- Check Market Panel (regime + stability)
- Confirm alignment in Trend Matrix
- Inspect current price structure in Support & Resistance
- Pick a candidate from Trading Models
- Open Trader Detail for deeper validation