Dashboard Overview explained
The Dashboard Overview is the entry point for scanning your available symbols before you drill into one symbol dashboard.
What this page is for
- See a quick health snapshot of the current platform state
- Compare symbols at a glance
- Open the full symbol dashboard for a specific market
Main areas
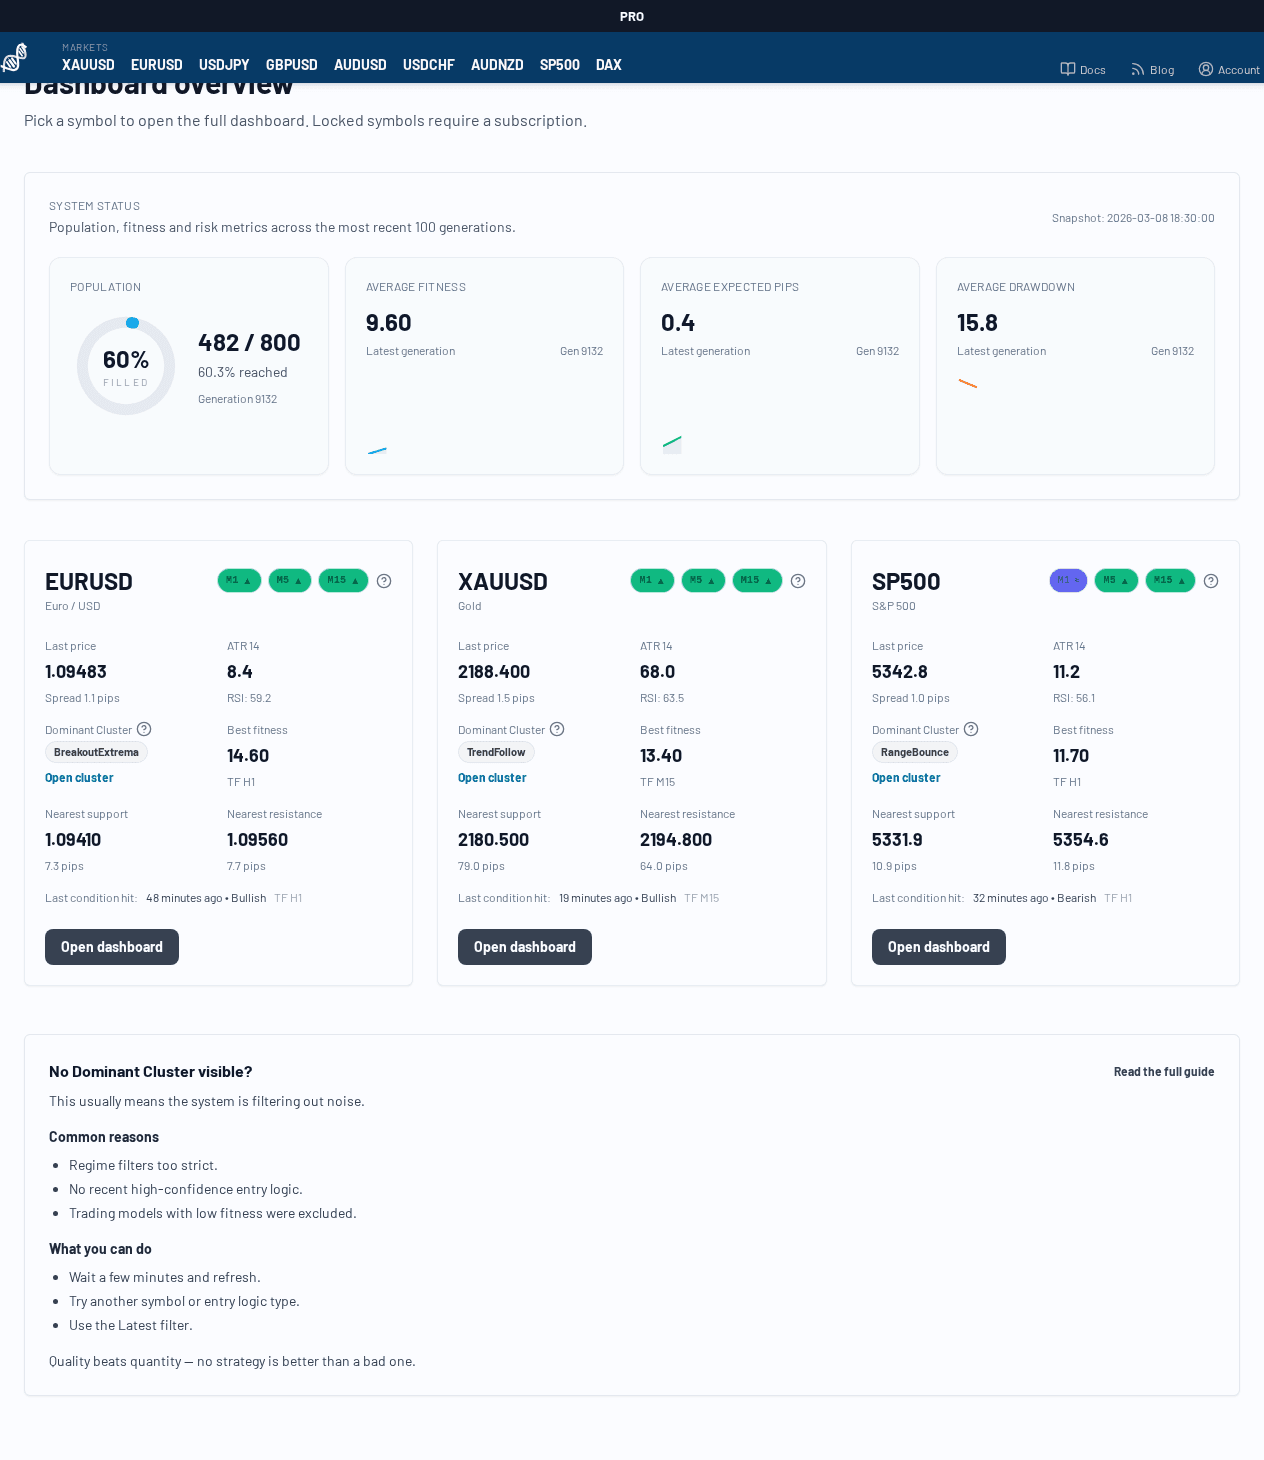
1. System Status (top panel)
This panel summarizes the latest platform snapshot:
- Population: current number of active Trading Models vs. capacity
- Average Fitness: aggregate quality trend of the active model population
- Average Expected Value: average expected pips/trade across the current population
- Average Drawdown: aggregate drawdown pressure across the current population
- Snapshot timestamp: when this overview snapshot was generated
Use this panel to judge whether the system is broadly stable or currently in a weaker phase.
2. Symbol cards
Each symbol card (for example EURUSD, XAUUSD, DAX) is a compact summary and navigation card.
Typical card contents:
- latest price / market snapshot
- trend indications (direction + strength)
- nearest support / resistance context (if available)
- number of active Trading Models for that symbol
- entry point into the full symbol dashboard (
Open dashboard)
If a symbol is locked, you may still see the card but not the full detail dashboard (depending on your subscription).
How to use it (recommended workflow)
- Start in Dashboard Overview
- Compare a few symbols by current trend and model activity
- Open the symbol dashboard for the market you want to analyze
- Use the symbol dashboard to inspect market regime, trend matrix, support/resistance, and live model list