Trend Matrix field guide
Trend Matrix field guide
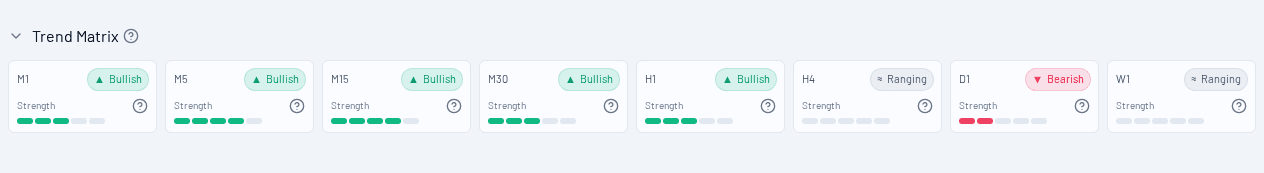
The Trend Matrix shows the current directional state and trend strength across multiple timeframes.
It appears in the symbol dashboard and is one of the fastest ways to assess multi-timeframe alignment.
Timeframes shown
The matrix covers:
M1M5M15M30H1H4D1W1
What each row means
Each row has two parts:
- Direction
- Strength (1-5)
Direction
Possible values:
- Bullish (▲): upward directional bias
- Bearish (▼): downward directional bias
- Ranging (≈): sideways / no clear directional edge
Strength (1-5)
A compact score for trend intensity/quality in that timeframe:
- 1-2: weak
- 3: moderate
- 4: strong
- 5: very strong
Ranging typically has no meaningful trend strength (effectively neutral).
How to interpret it
High-confidence directional context
If several adjacent timeframes align (for example M5, M15, H1 all bullish), that often indicates a cleaner directional regime.
Transition / conflict context
If short timeframes are bullish but higher timeframes are bearish or ranging, you may be in:
- a pullback
- a reversal attempt
- a noisy transition phase
Range context
If many timeframes show Ranging, trend-following models may weaken while mean-reversion behavior may become more relevant.
Common mistakes
- Looking only at
M1and ignoring higher-timeframe conflict - Treating strength as a price target (it is not)
- Ignoring the Trend History section, which shows whether the current state is strengthening or fading