Trader history metrics chart explained
Trader history metrics chart explained
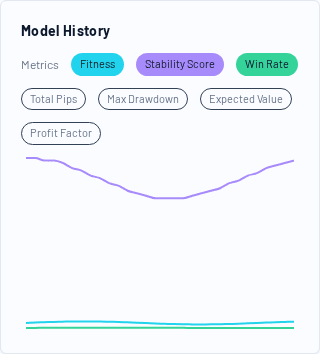
The Model History chart in the Trader Detail view shows how key metrics changed across historical backtest snapshots of the same Trading Model.
This is one of the most useful tools for spotting model degradation or improving consistency.
What the chart shows
- X-axis: historical backtest snapshots over time
- Y-axis: metric value (hidden scale; depends on selected metrics)
- Colored lines: selected metrics
You can toggle metrics on/off using the metric chips above the chart.
Available metrics (current UI)
Fitness
Raw evolutionary ranking value used internally for selection.
- Higher is generally better
- Best used together with robustness/stability-related metrics
Stability Score
A compact stability/robustness signal for the model.
Use it to compare consistency over time, especially when Fitness alone is volatile.
Win Rate
Share of winning trades in the backtest snapshot.
Displayed as a percentage.
Total Pips
Total pips accumulated in the backtest snapshot.
Useful for broad performance direction, but should be interpreted with drawdown and expected value.
Max Drawdown
Largest historical drawdown in the snapshot.
Rising drawdown with flat fitness is often a warning sign.
Expected Value
Estimated pips/trade edge for the snapshot.
Helpful for comparing model quality across time even if trade counts differ.
Profit Factor
Gross profits divided by gross losses.
Use it as a quality metric, especially combined with win rate and drawdown.
How to interpret changes over time
Healthy pattern
- Fitness stable or improving
- Stability score stable or improving
- Expected value positive and relatively consistent
- Drawdown controlled
Warning pattern
- Fitness fluctuates heavily
- Stability score declines
- Drawdown increases
- Expected value compresses toward zero or negative
Why this matters
A model can look strong in the latest snapshot but still be deteriorating when viewed across multiple snapshots.
The history chart helps you avoid overreacting to a single backtest point.
Practical comparison workflow
- Start with Fitness + Stability Score + Expected Value
- Add Max Drawdown
- Add Win Rate or Profit Factor for confirmation
- Look for trend consistency, not single-point spikes